MGnify API data hunt
This tutorial provides an introduction to the API (Application Programming Interface) and tools & methods that can be used to access microbiome data programmatically from MGnify. You will learn about the structure of the API and the data, as well as how to write scripts to analyze data programmatically.
 These instructions assume you are using the EBI Training Virual Machines. If you’re running this on your own computer instead, remember that some file paths will be different. In particular,
 /home/training/ will be /home/<yourusername>.
Learning objectives
Understand how to access data using MGnify API
Understand how to filter data sets using metadata
Learn how to write scripts to programmatically access to the data
Prerequisites
For this tutorial you will need a install the software using miniconda and a working directory to store the data.
Miniconda has been pre-installed in the VM but it is easy to install, instructions here.
Open the terminal and execute the following instructions:
mkdir -p /home/training/api_session

cd /home/training/api_session

conda create -n mgnify-api python=3.8

conda activate mgnify-api

pip install pandas numpy scipy plotnine jsonapi-client mg-toolkit requests

curl http://ftp.ebi.ac.uk/pub/databases/metagenomics/mgnify_courses/ebi_2020/api.tar.gz | tar xz --strip 1
You have just created a directory to store all the data, installed the required software and downloaded the scripts and expected results from the EBI ftp server.
An introduction to MGnify REST API
MGnify is a freely avaiable hub for the analysis and exploration of metagenomic, metatranscriptomic, amplicon and assembled datasets. The resource provides rich functional and taxonomic analyses of user-submitted sequences, as well as analysis of publicly avaiable metagenomic datasets drawn from the European Nucleotide Archive (ENA).
How to browse data using MGnify REST API
The MGnify REST API allows retrieval of over 400.000 (and counting) publicy avaiable metagenomics, metatranscriptomic, amplicon and assembly datasets, sampled from diverse environments.
The base URL to the API is: https://www.ebi.ac.uk/metagenomics/api
The API documentation at: https://www.ebi.ac.uk/metagenomics/api/docs
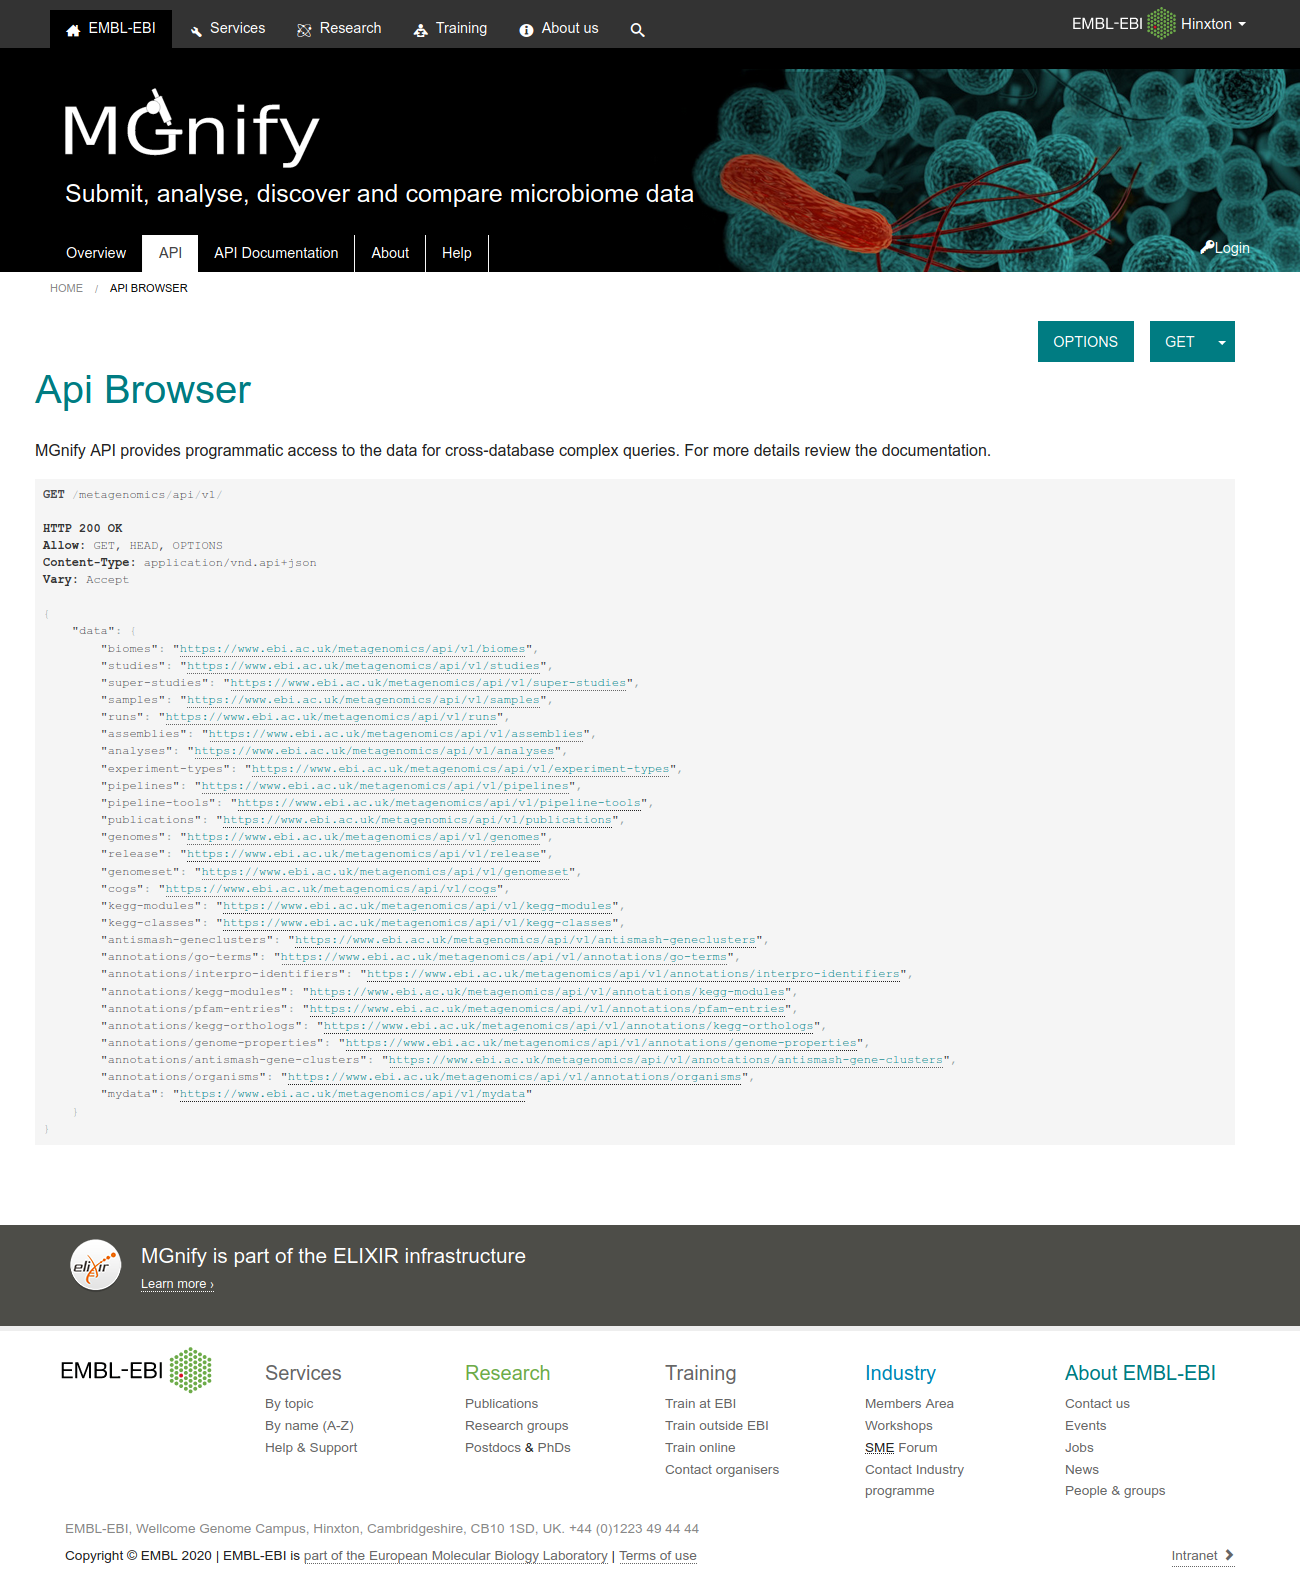
Figure 1: MGnify API browser.
The base URL provides access to several resource collections, such as studies samples, runs, analyses, genomes, biomes and experiment-types
 Open https://www.ebi.ac.uk/metagenomics/api/latest/studies in your browser. This will a paginated list of all of the publicy available studies. Now open the list of samples using: https://www.ebi.ac.uk/metagenomics/api/latest/samples
Details about a single project can be retrieved by providing a unique identifier assigned during the archiving process. For example, https://www.ebi.ac.uk/metagenomics/api/latest/studies/ERP009703 provides access to the Ocean Sampling Day (OSD) 2014 project.
Retrieve the list of samples contained in this study using the following URL: https://www.ebi.ac.uk/metagenomics/api/latest/studies/ERP009703/samples. Explore the response, at the bottom of the page you can find the number of pages that match this query.
Now, retrieve all the analyses performed on this study using: https://www.ebi.ac.uk/metagenomics/api/latest/studies/ERP009703/analyses.
 Question 1: Is the number of samples the same as the number of analyses?. What could be the reason?
Parameters can be added to the URL to filter and sort the data, allowing the construction of more complex queries. The API browser lists the filters that are avaiable, as ilustrated in Figures 2 and 3.
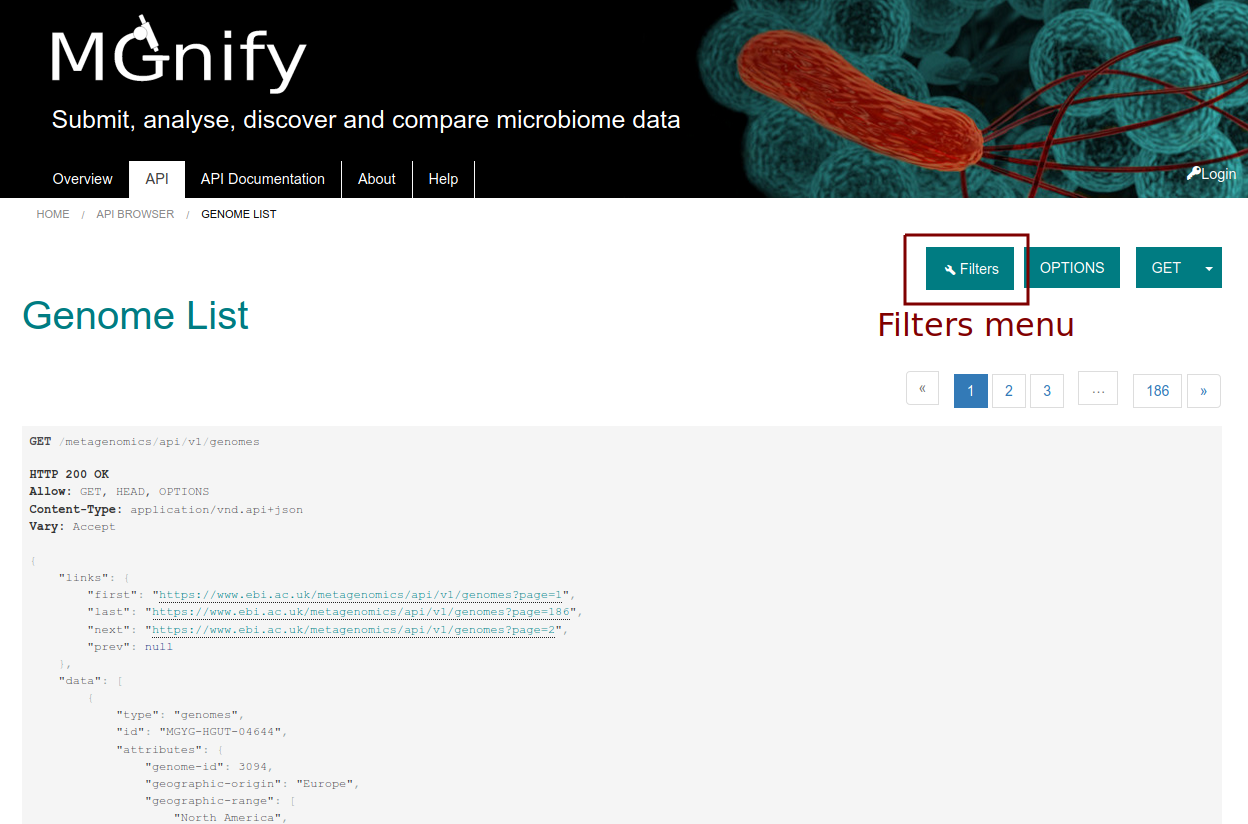
Figure 2: Filters menu in MGnify API browser.
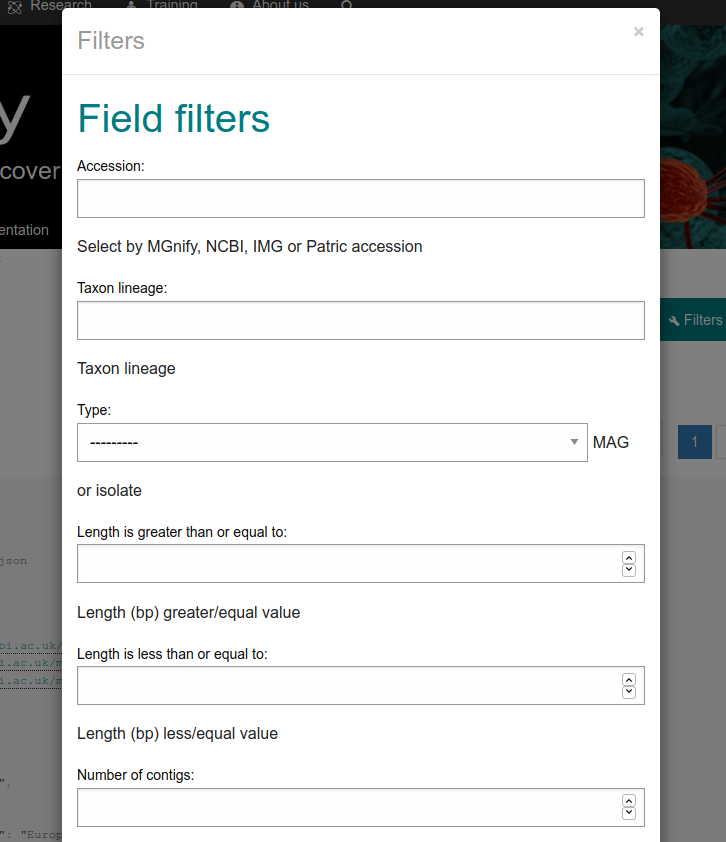
Figure 3: Filters pop up menu for the Genomes list endpoint.
Question 2: Using the API browser, how many results have been analysed with the pipeline version 4.0 for the OSD study ERP009703?
Programmatic access
In the next few exercies we are going to utilize some Python scripts to interact with the MGnify REST API programmatically.
The data and scripts are also available in the source code of this documentation.
Data exchange format
The industry default data exchange format for Web API is JSON. This format is a compact and human-readable way of representing data. A brief overview of the format json.
The MGnify REST API returns a JSON object formatted data structure that contains the resource type, associated object identifier, attributes and relationships to other resources, allowing the construction of complex queries.
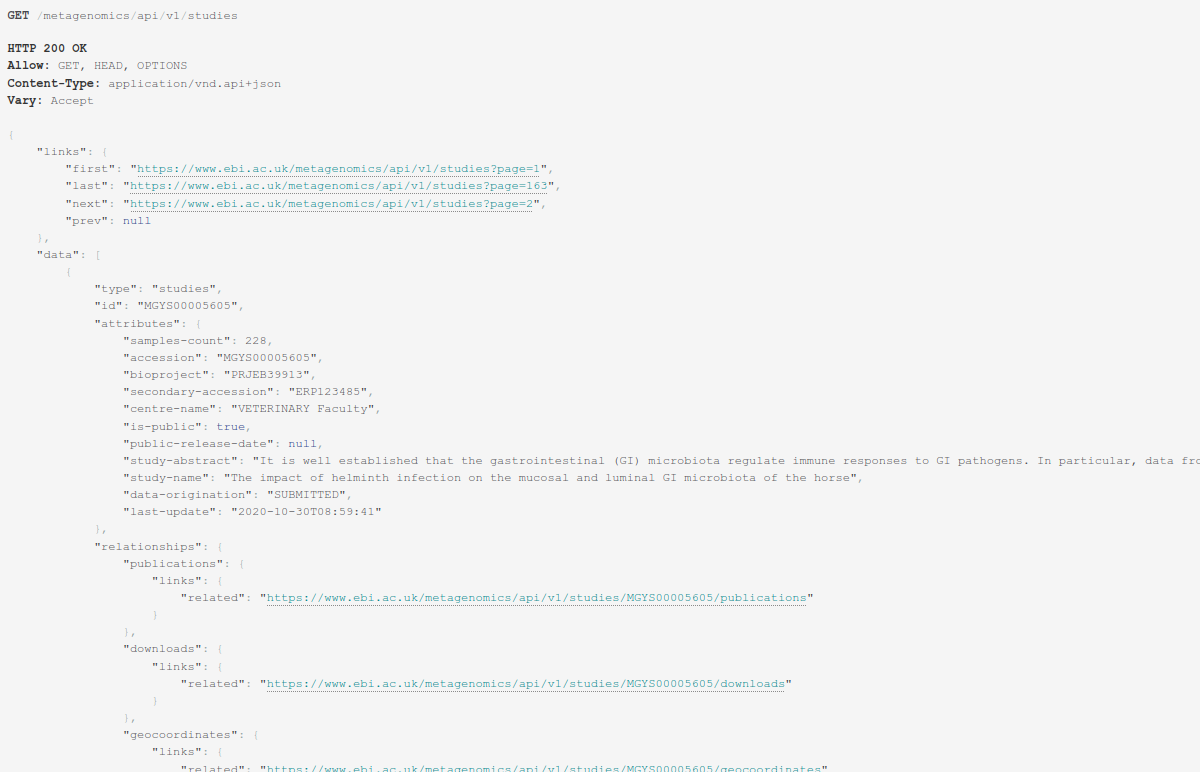
Figure 4: MGnify response output in JSON format.
Standardized format data structures allow third party libraries in many programing languages to easily access data programmatically.
Exercise 1
In this exercise you will browse sample metadata and visualise analysis results. First we are going to look at retrieving samples that match particular metadata search criteria.
Read the code of the exercise1.py script. This script is using the API to obtain a subset of the samples.
Question 3: What “type” of data is the script downloading?. Which filters are being used to get the filtered data from the API?.
Run the script exercise1.py in the console:
python exercise1.py
Using these few lines of Python, we are able to retrieve the complete set of oceanographic samples taken at the Arctic Ocean (latitude > 70) across all publicly available studies in MGnify.
Inspect the generated exercise1.csv file.
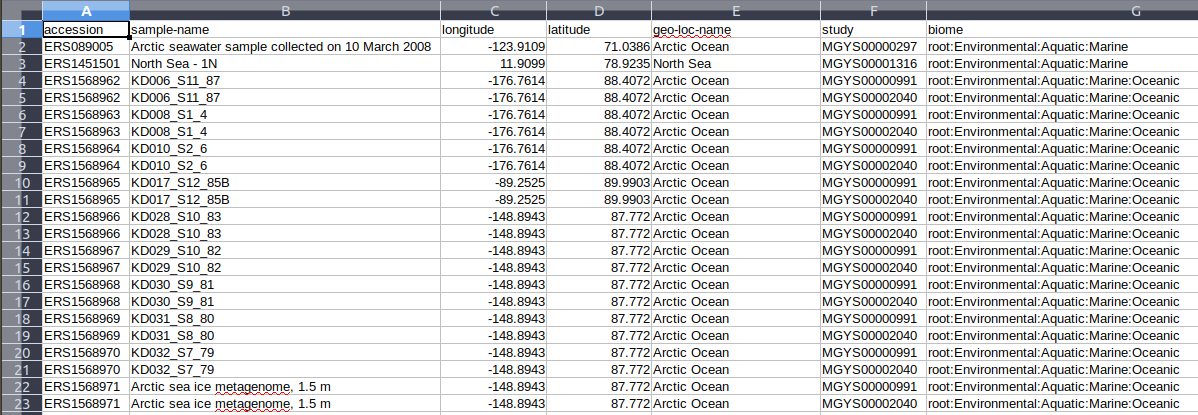
Figure 5: Exercise 1 retrieved data in CSV format.
Question 4: How might you adapt the script to find soil samples taken at the equator?.
Add an additional parameter ‘“study_accession”: “MGYS00000462”’ to the filters section in the script exercise1.py and run it again. You can check the study in the website MGYS00000462.
Question 5: How many of the OSD2014 samples were taken from the Arctic Ocean?
Exercise 2
For this exercise we will use the MGnify REST API to obtain data and then visualize the analysis results of the study “Metabolically active microbial communities in marine sediment under high-CO2 and low-pH extremes MGYS00002474 (DRP001073). In this study, DNA was extracted from sub-seafloor sediments and domain specific 16S rRNA gene primers were used to profile the archaeal and bacterial taxonomic communities.
We will begin by retrieving taxonomic analysis data and then plotting relative abundance in the form of bar charts.
Open the file exercise2.py. Read the code, even if you don’t understand python the variables and constants at the beginning of the file will allow the script to be easily modified. Note, there are a series study accessions that are currently commented out which will allow you to rerun the analysis with other projects. Ignore them for the time being and run the code with MGYS00002474 and inspect the resultant bar chart.
python exercise2.py
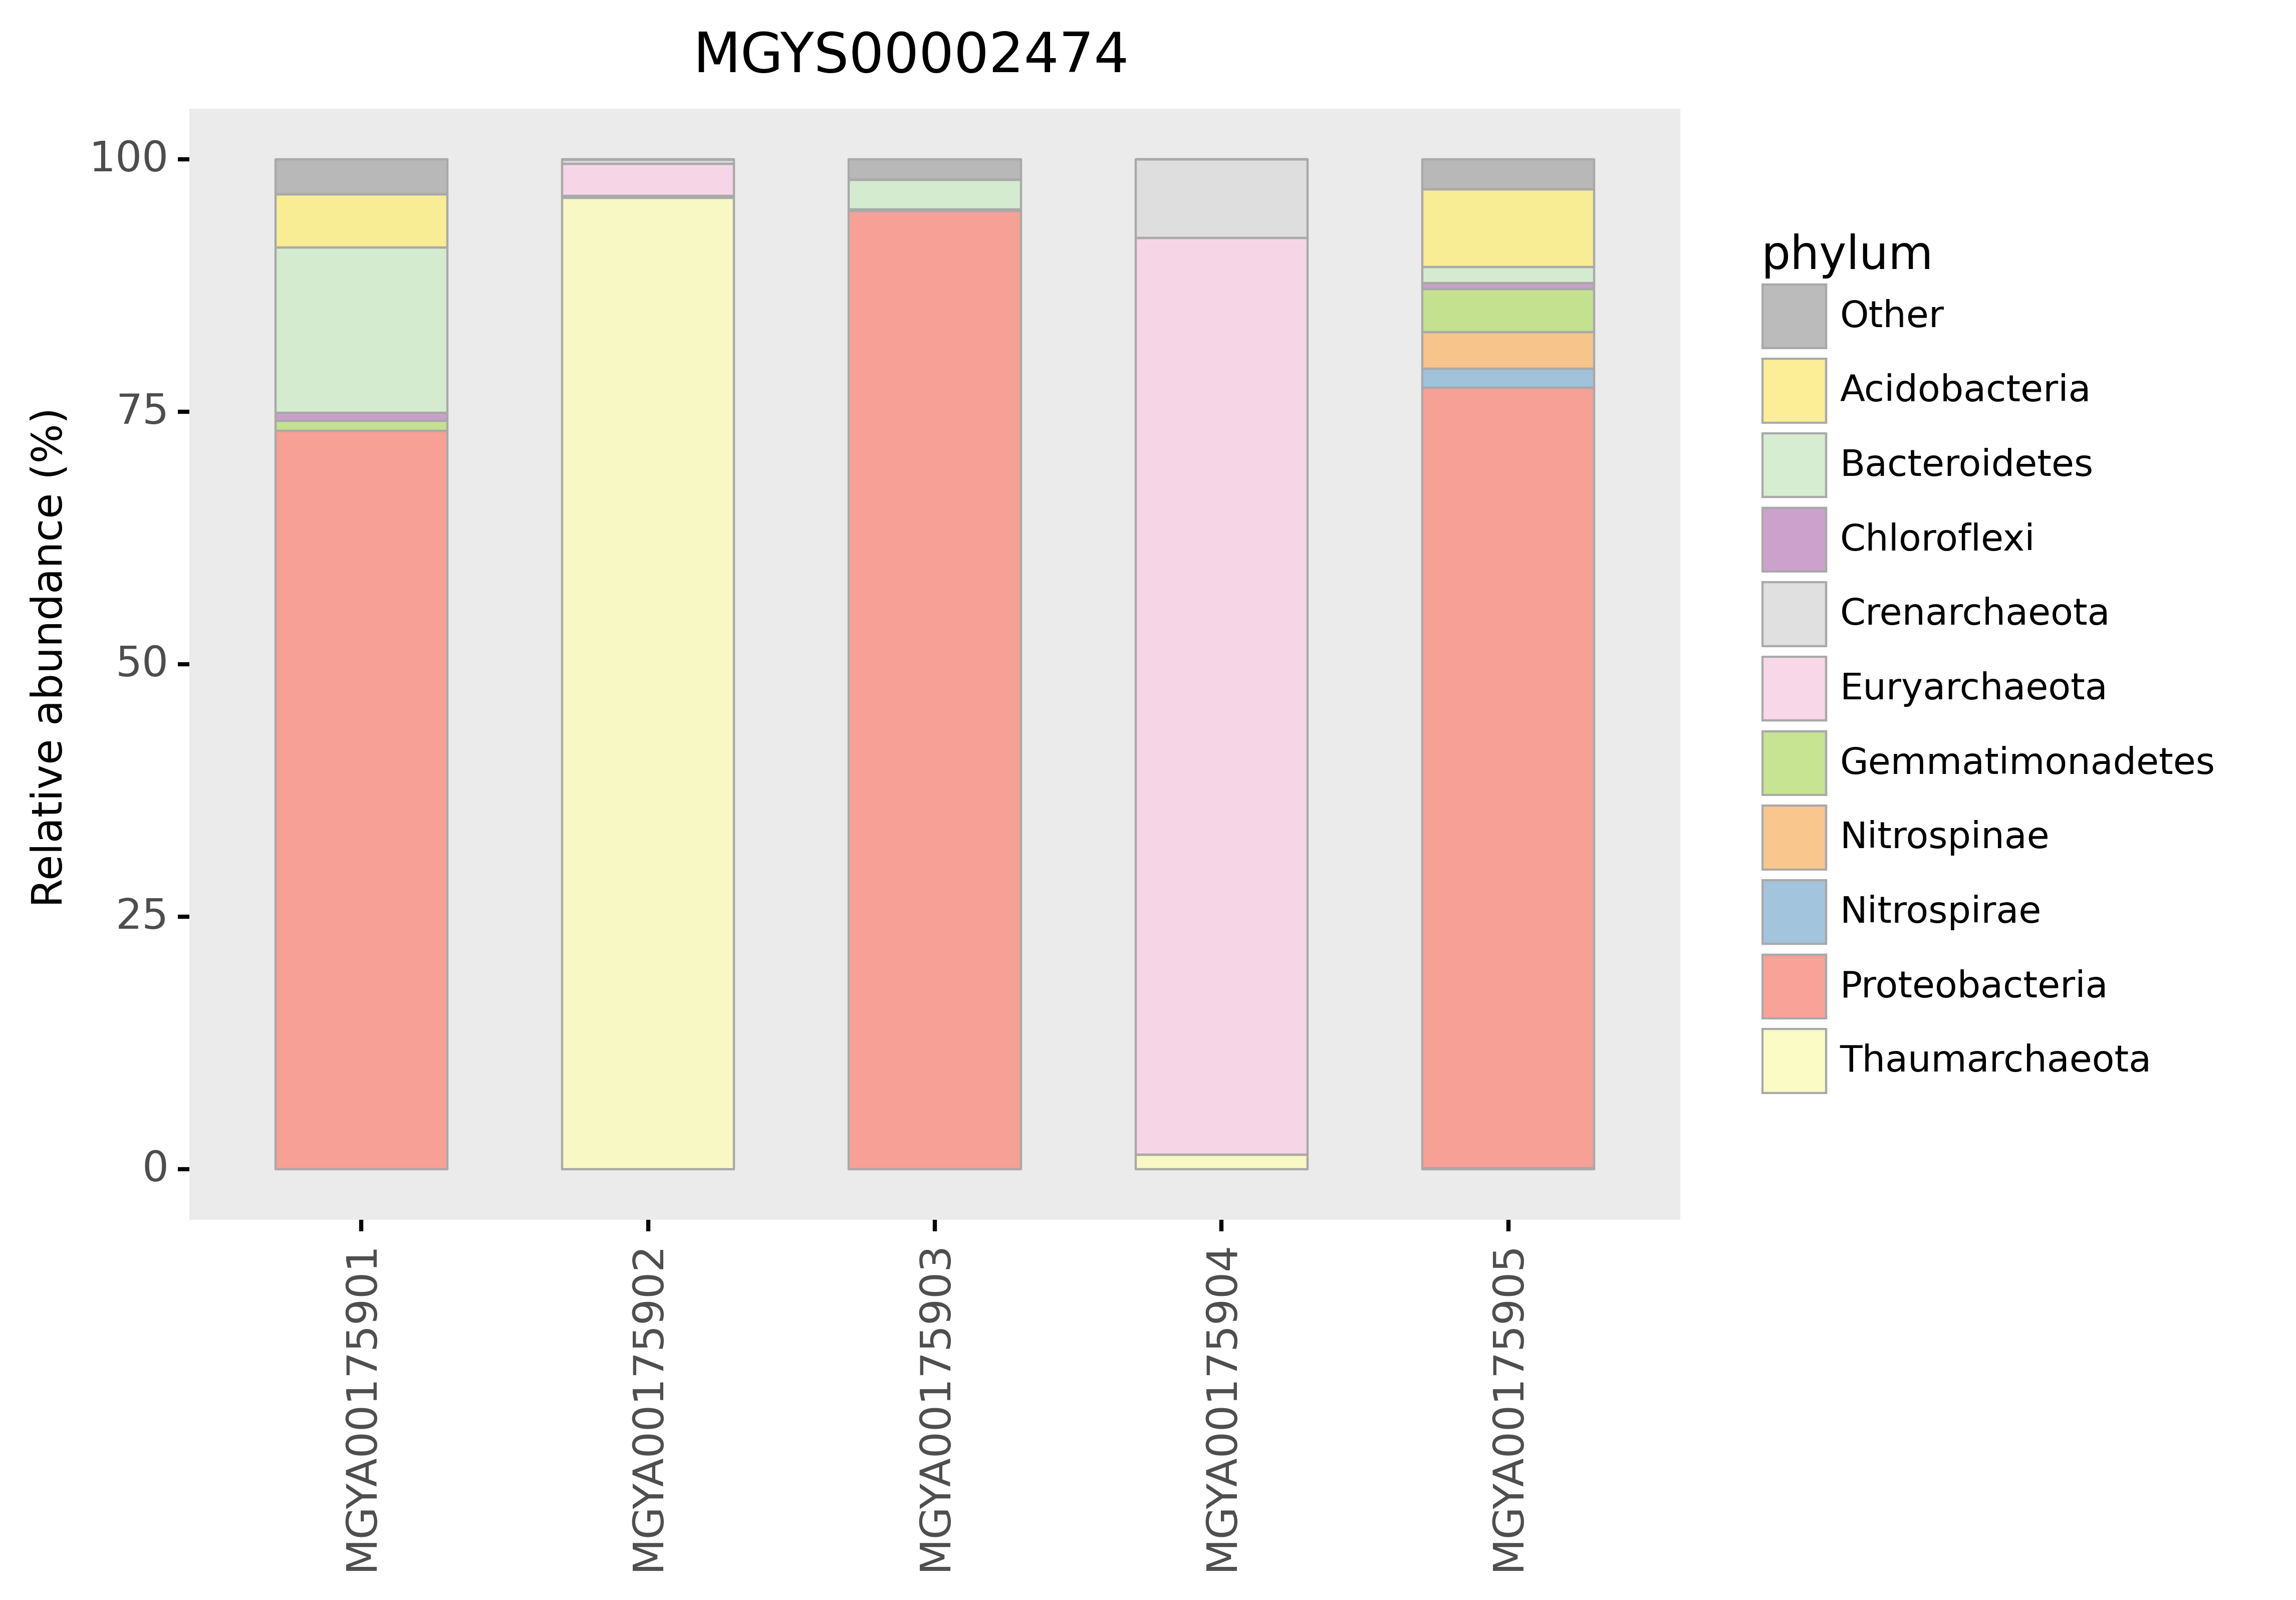
Figure 6: Microbiome diversity in the study MGYS00002474 (DRP001073) at the phylum level.
Question 6: How similar or different are the phylum compositions of each analysis?. How might you explain any differences?.
Question 7: How many of the analyses look to target bacterial populations and how many are targeting the archaea?
It’s easy to adapt the script for other analyses. For example, if you change the variable TAX_RANK (line 13 in exercise2.py) to “genus” you can obtain the genus level results.
Question 8: How might you adapt the code for the analysis of other studies:
perform analysis of taxonomic results bases on the large ribosomal subunit rRNA or the ITS region for fungi?
output the top 20 genera, rather that the top 10?
Exercise 3
For this exercise we will use the MGnify REST API and the MG-Toolkit to download analysis files. The toolkit is a command line application. At the moment of writing this the toolkit doesn’t support MGnify genomes, for this resource we will use the MGnify REST API.
We installed the toolkit when we created the conda environment.
Question 9: What type of data can we download using the Toolkit?.
Download the metadata for the study “DRP001073 (MGYS00002474)”. Execute the following command:
mg-toolkit original_metadata -a DRP001073
Explore the generated csv file DRP001073.csv. Can you notice if there is something wrong with the metadata?
Let’s download the functional annotations for one study. Run the following command in the terminal:
mg-toolkit bulk_download -a MGYS00005575 --result_group pathways_and_systems
This may take a few minutes.
Question 10: Based on the files the toolkit has downloaded, how many analyses has the study MGYS00005575?.
For the genome resource we will use the API directly to obtain all the Download files for the genome: MGYG-HGUT-04644
Open the file exercise3.py. Read the code. This script will download all the files from the download’s relationship for the selected genome.
Execute the script to fetch the files:
python exercise3.py
Explore the different files that were downloaded.
Question 11: How could you modify the script exercise3.py to download the other functional annotations?.
Solutions
To get the solutions to all the questions and R versions of the scripts follow this link.